

Grow Your Patient Base
Built by physicians for providers, powered by SEO
Increase your visibility across search engines and AI platforms
PraxisIQ
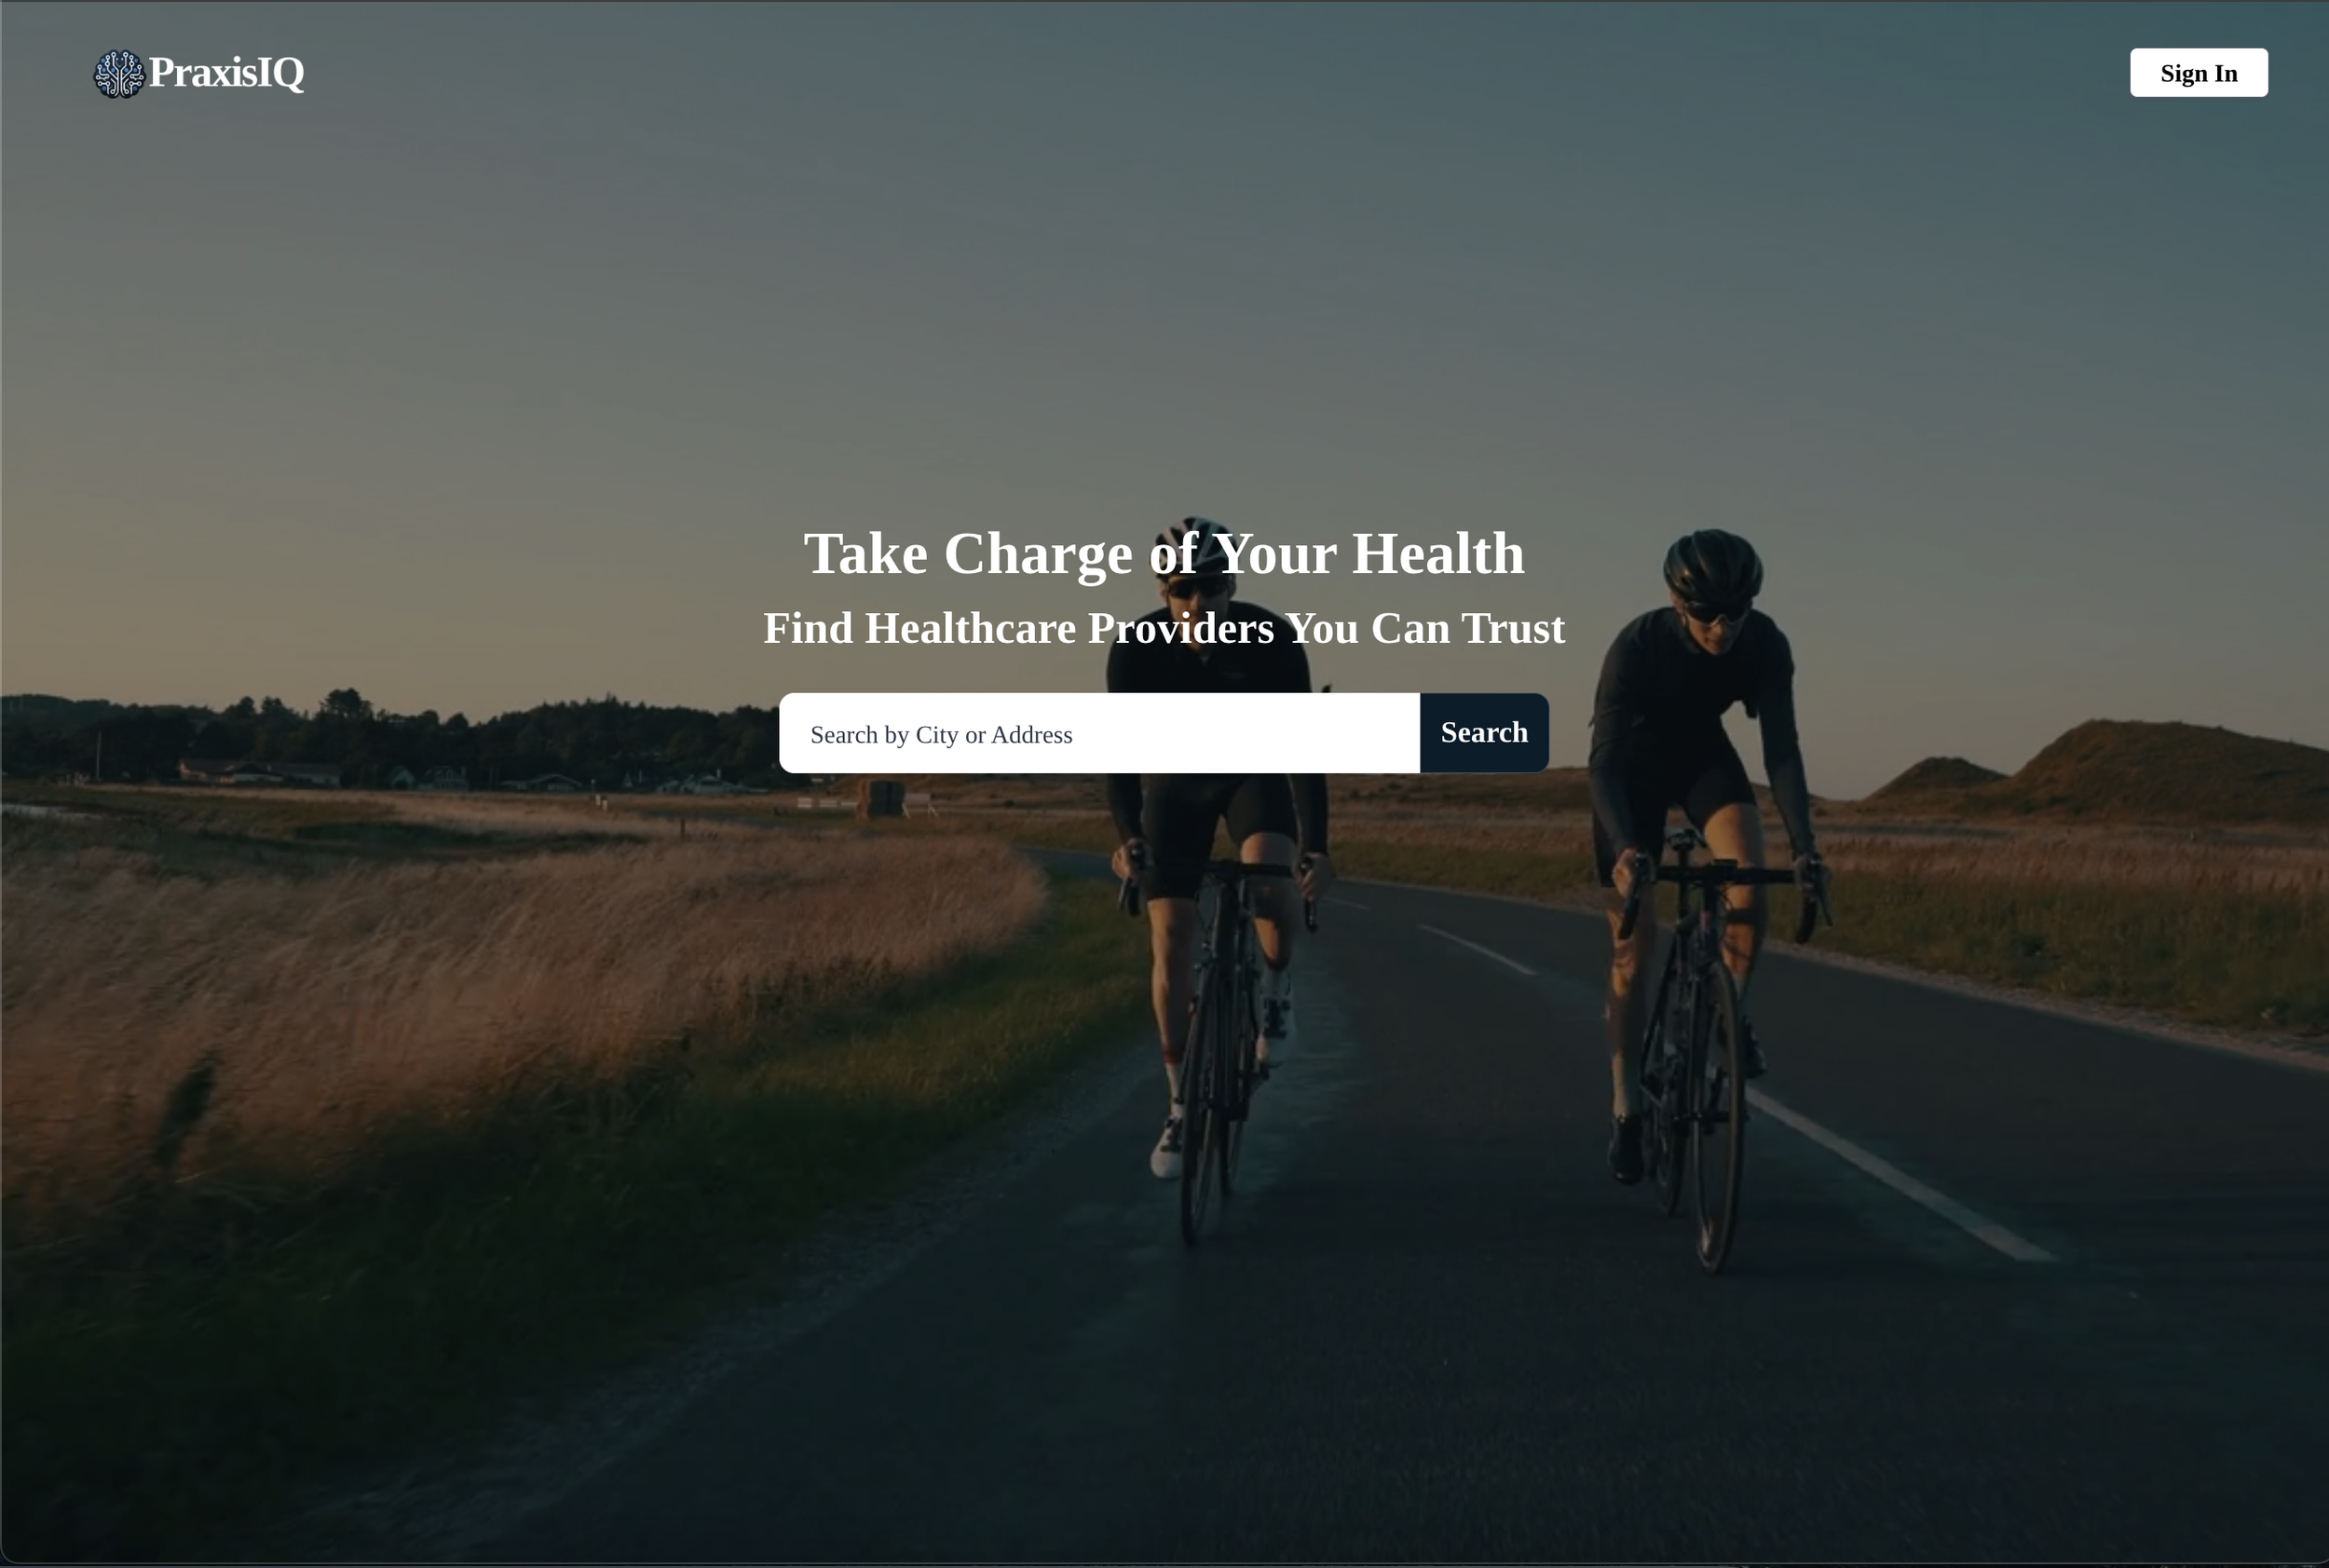
PraxisIQ is a practice listings marketplace empowering users to search, compare, and follow providers — from surgery practices to medical spas — and choose with confidence. For healthcare professionals, PraxisIQ unlocks strategic insights to grow referral networks, increase visibility, and attract more patients.
-
Reach more patients and showcase practice-specific insights
-
A beautifully designed, search-driven platform for fast provider discovery — with a follow feature that keeps patients informed and engaged
-
Reach more patients and keep your existing network engaged with our follow feature